Handling a RDS MySQL cluster CPU 100%
The Incident
Today I got a performance issue from our analytic team, saying they experienced a Production MySQL cluster running on RDS very slow since yesterday morning.
I started to look into bellow areas for investigation:
- AWS CloudWatch Metrics for RDS
AWS CloudWatch provides a wide range of metrics that can help diagnose resource usage for databases. So I started with
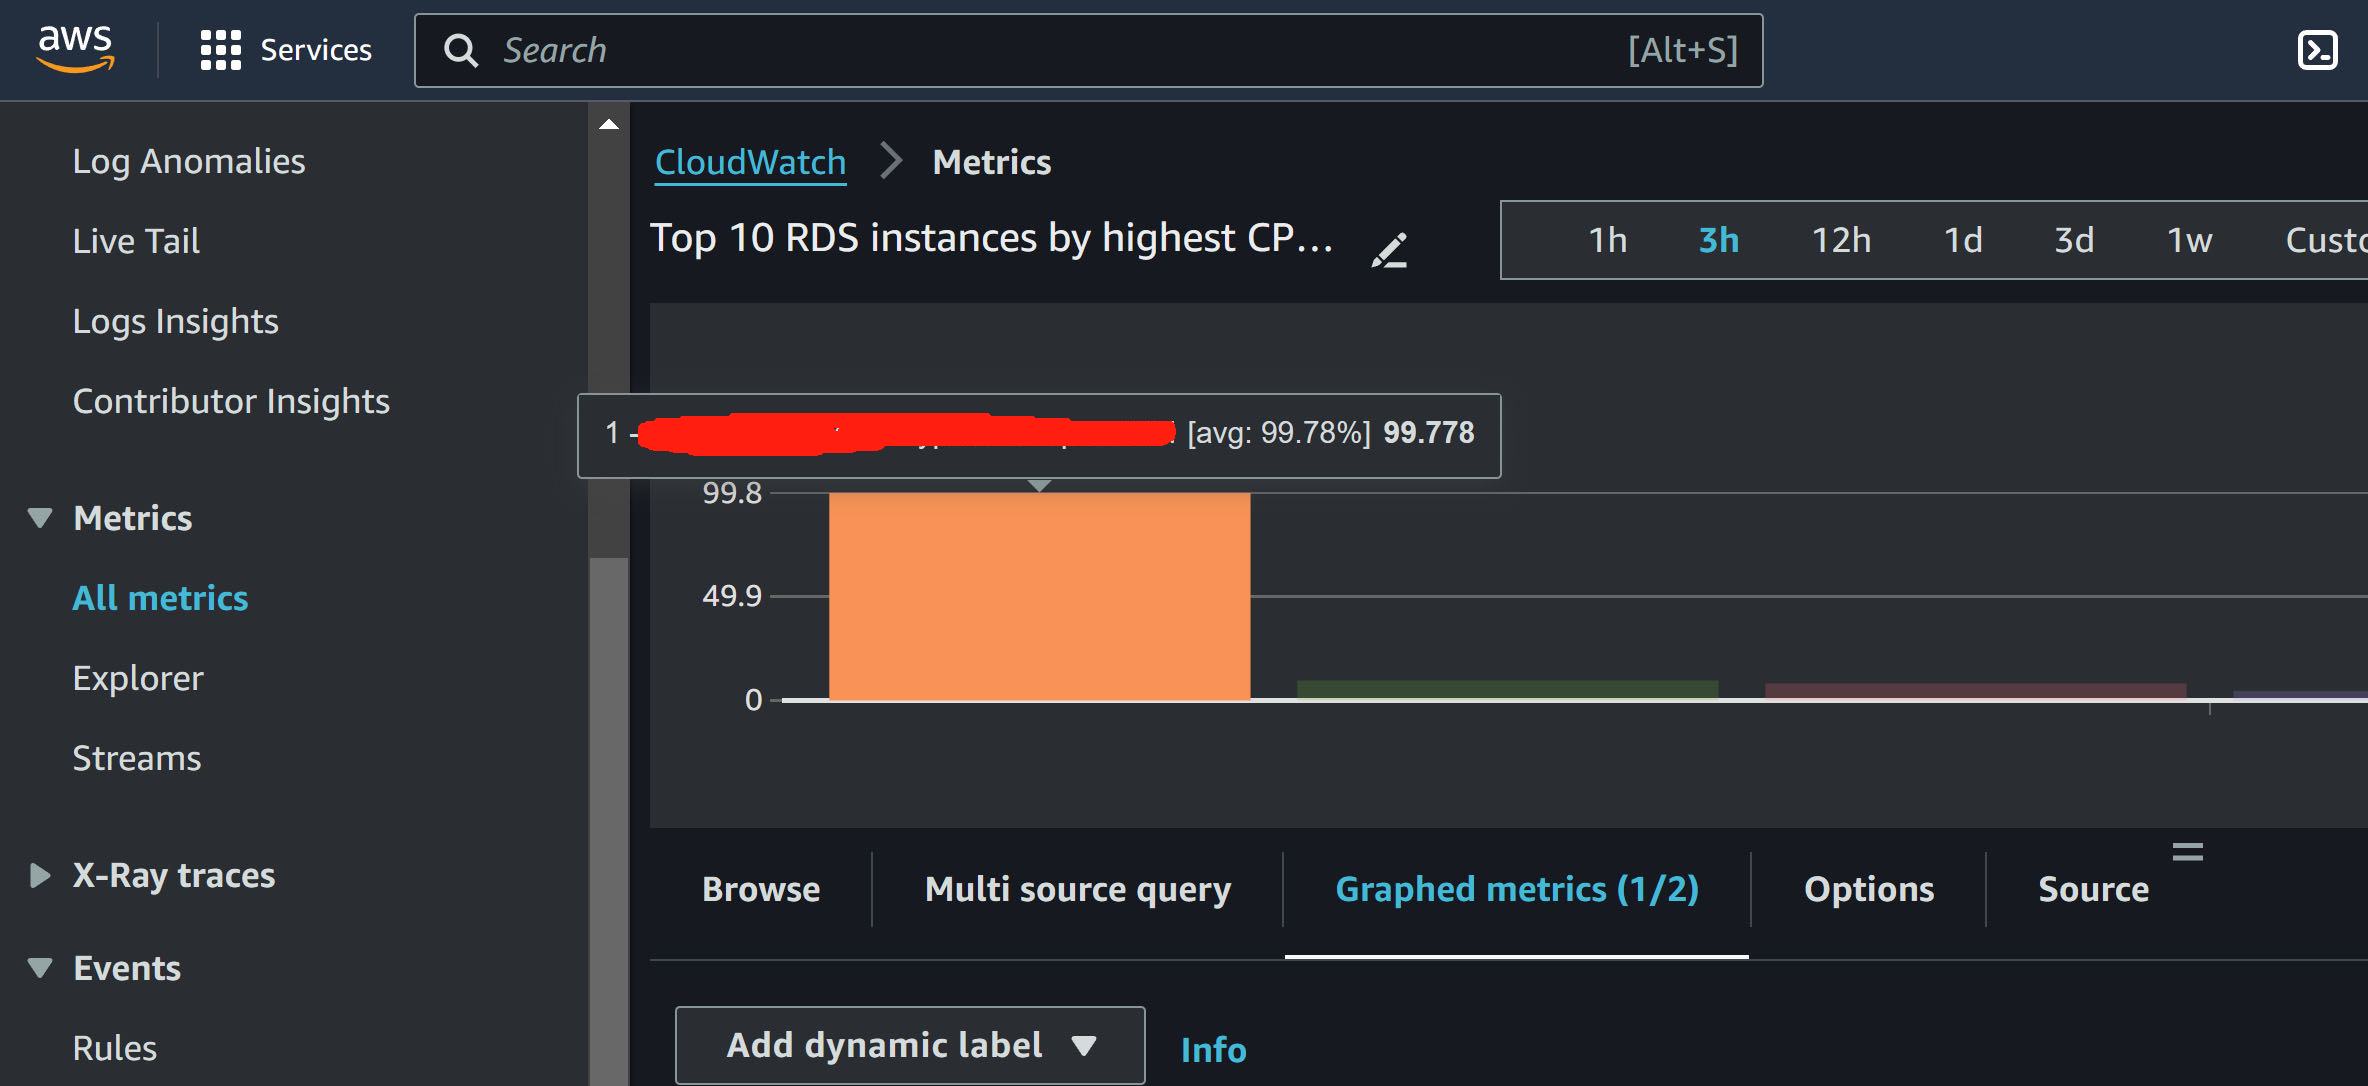
CloudWatch - Metrics - All metrics - Add query - RDS - Top 10 RDS instances by highest CPU utilization
This only queries the recent 3 hours metrics, but it is enough for me to identify the issue: CPU 100%
To further understand the high CUP, I go:
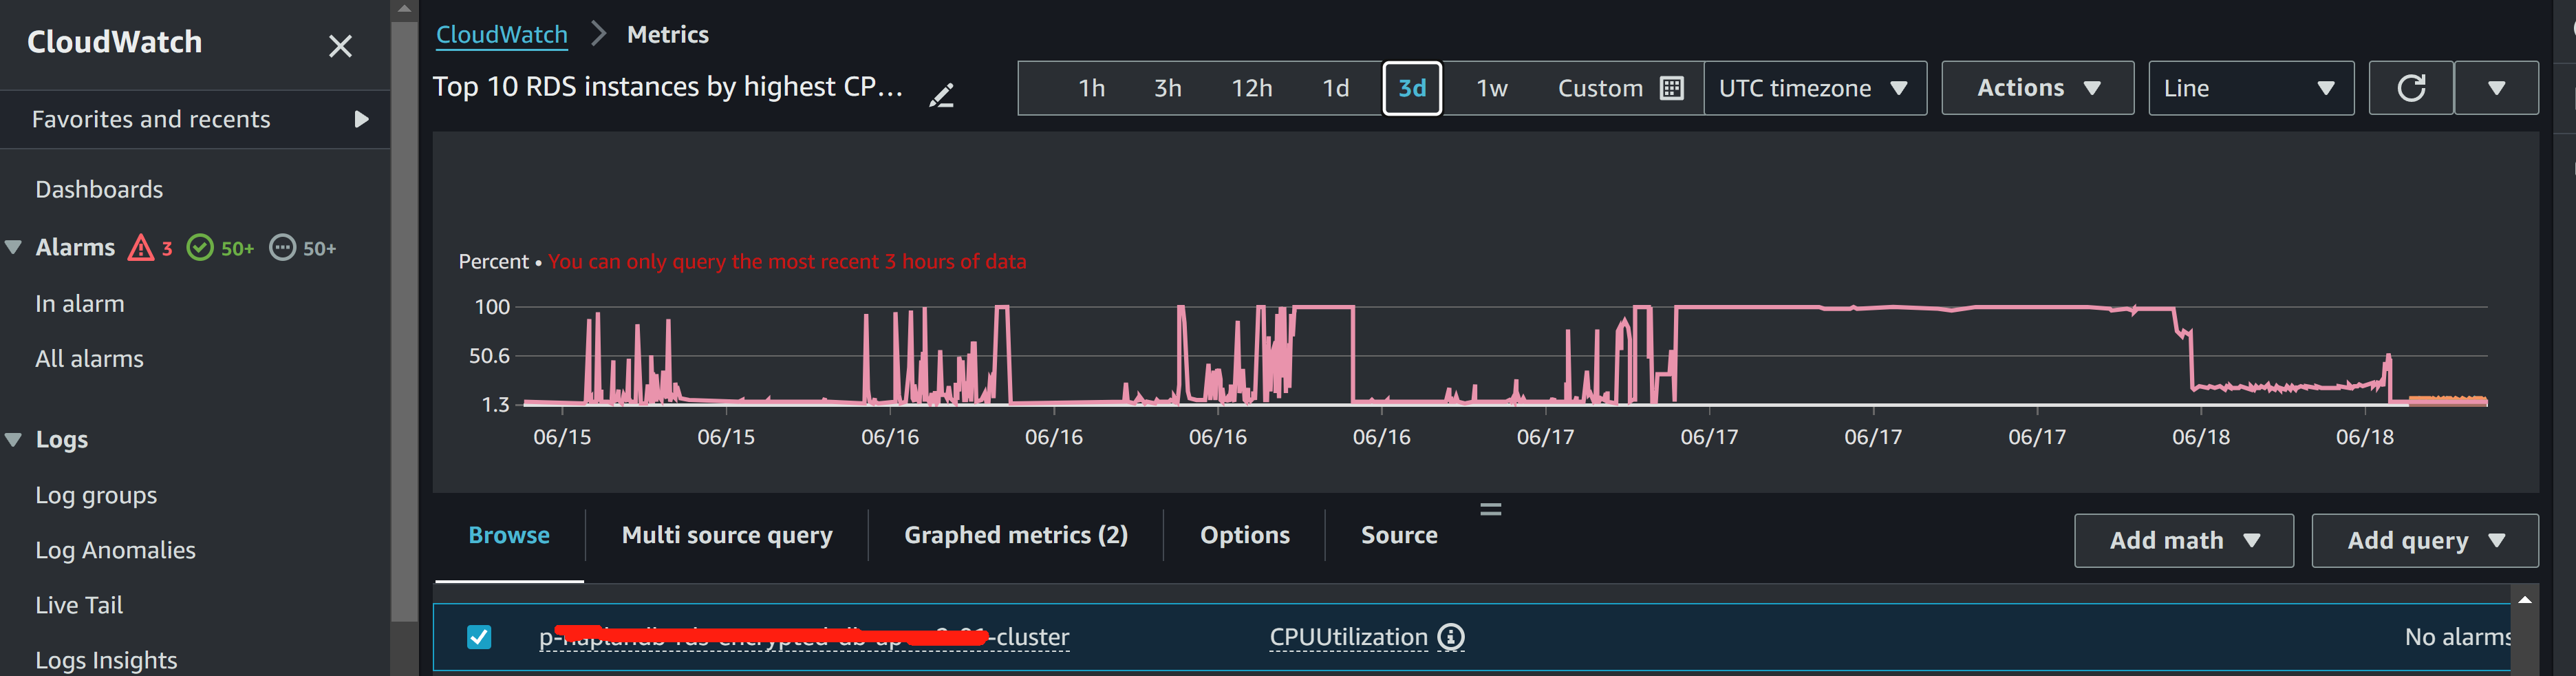
CloudWatch - Metrics - All metrics - Browse - RDS - DBClusterIdentifier - CPUUtilization
which gives me a long period of monitoring, so I can see it started to 100% CPU since yesterday morning.
- AWS console RDS Logs & events
Now let’s find out from the RDS logs to see if any errors can indicate who could be the person. So I go
RDS - “the DB cluster” - “the DB instance” - “Logs & events” - “error/mysql-error-running.log.2024-06-18.02”
I got :
2024-06-18T00:04:58.750212Z 2831474 [Note] Aborted connection 2831474 to db: 'xxxxxx' user: 'xxxx' host: '10.xx.xx.xx' (Unknown error)
2024-06-18T00:12:00.798173Z 2831498 [Note] Aborted connection 2831498 to db: 'xxxx' user: 'xxxx' host: '10.xx.xx.xx' (Got an error writing communication packets)
----------------------- END OF LOG ----------------------
Up to here I generally have an idea of what is going on and can locate the person “xxxx” who was running something at the time CPU 100%.
- MySQL Client Tool to list, identiry and terminate long-running queries
It is time to log in to the RDS endpoint to see what is happening and which queries might cause the CPU usage. Here we need login via MySQL “root” to be able to see all other users’ running processes. Then pay attention to the high “Time” and “State” values indicating all the stuck processes, then we kill them and restart the RDS instance
mysql -u root -p -h rds_endpoint
SHOW PROCESSLIST;
KILL <process_id>;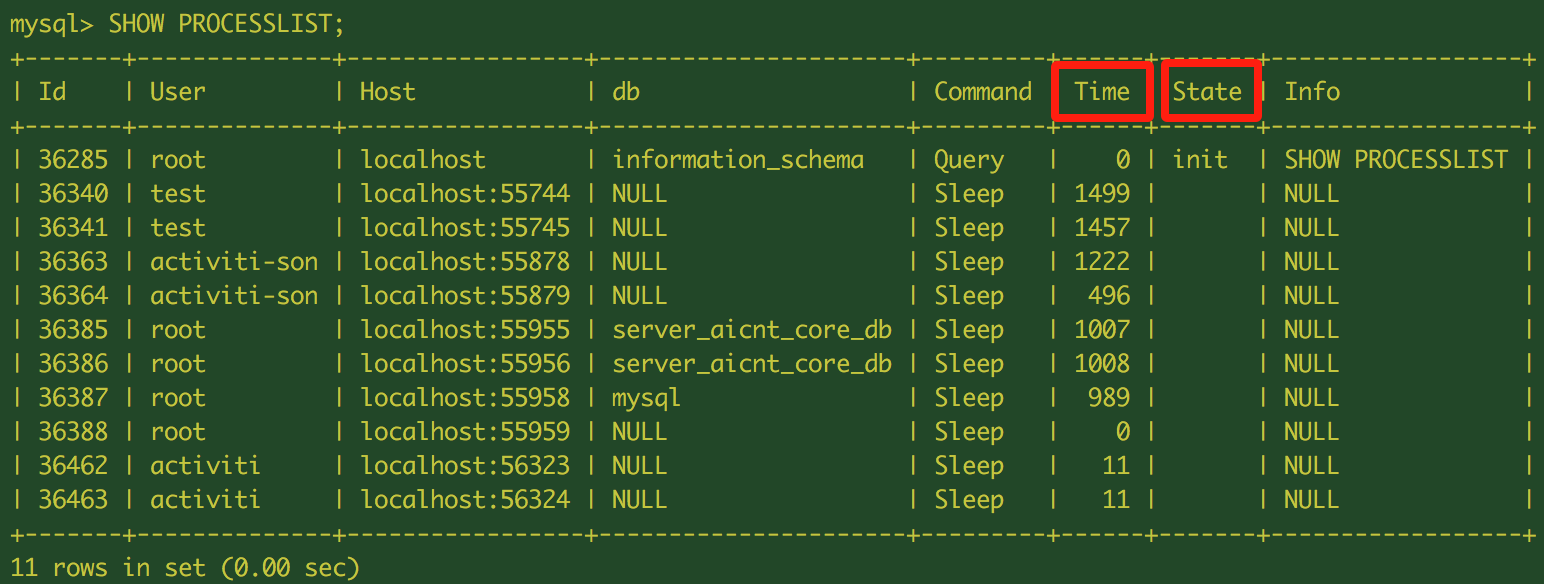
Then I go AWS RDS console - Actions - Reboot the RDS instance.
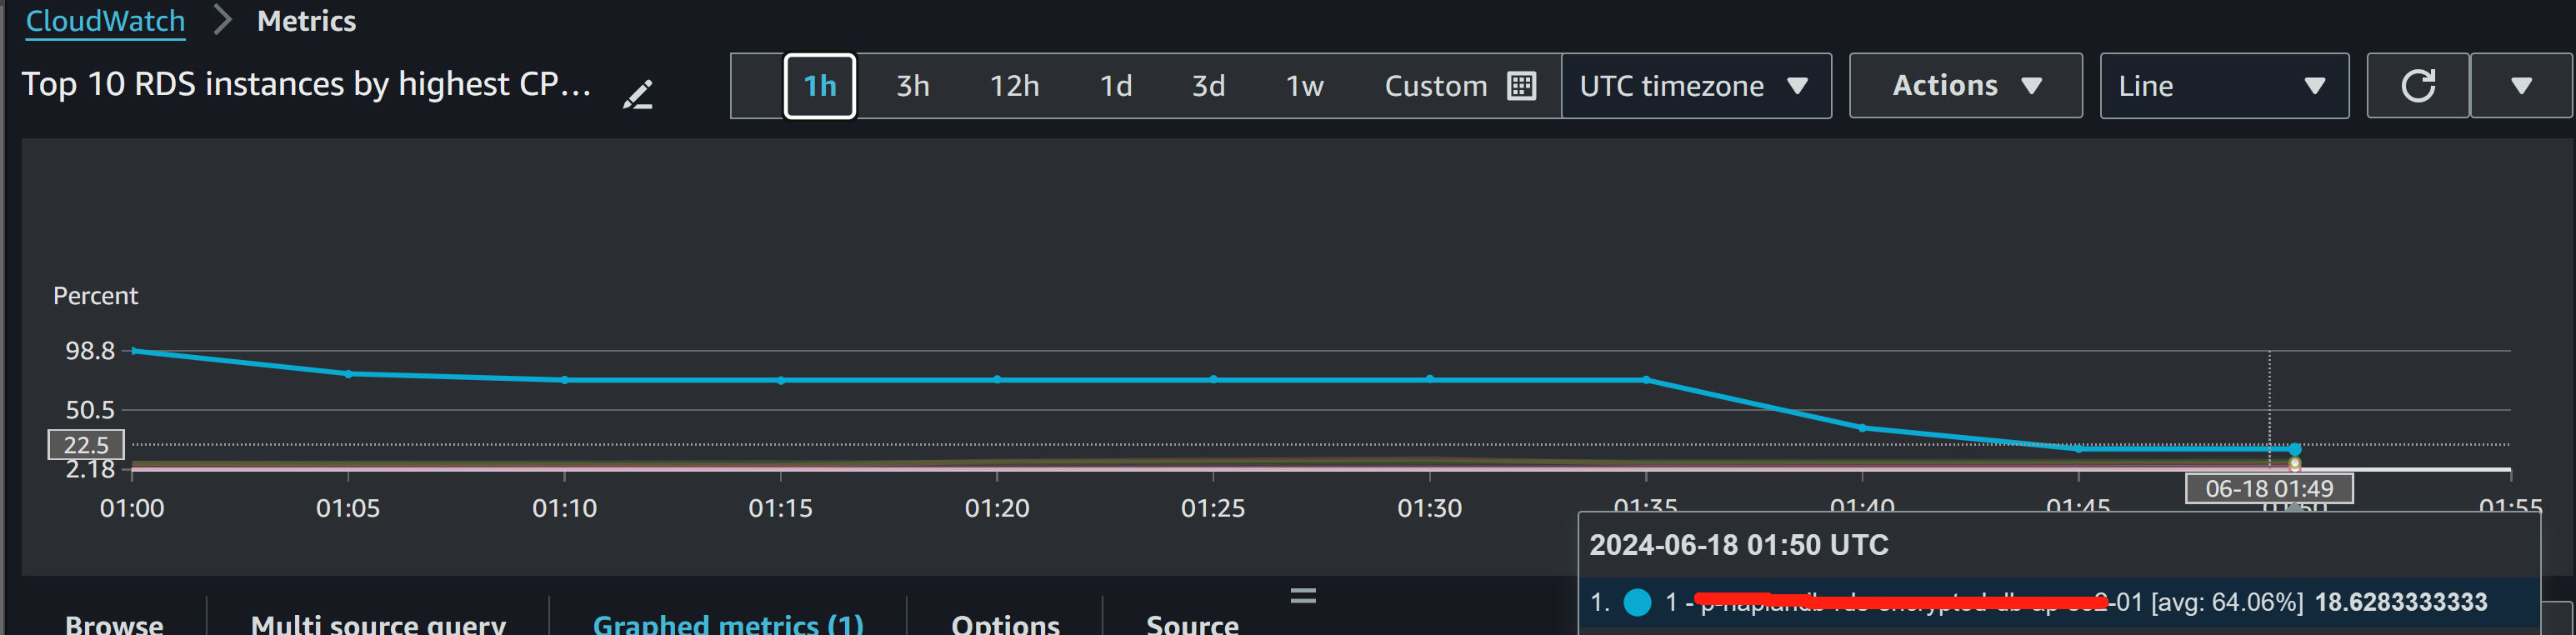
- Now the CPU usage started to drop and back to normal after terminating the stuck processes and DB instance reboot.
Done.
Conclusion
Even the issue had been fixed, I was still thinking how to better monitor RDS resource usage. I think we need:
-
A “CloudWatch Alarm” to set “CPUUtilization” metric threshold to 80%, then specify the period (e.g., 5 minutes) and the number of periods (e.g., 2 out of 3) that the metric must breach the threshold to trigger the alarm.
-
Create “SNS topic” with team Email for the alarm to send a notification
-
Enable “RDS Performance Insights”, this can monitor the load on the database, identify the source of bottlenecks, and understand how the DB is performing, especially during troubleshooting.
-
Enable “Enhanced Monitoring” and select the monitoring interval (e.g., 1 minute), which provides real-time metrics for the operating system that the DB instance runs on, this helps for immediate investigation on OS level
-
Enable “Slow Query Log” for regularly analysing slow query logs and performance insights to optimize RDS database queries, identify queries that take a long time to execute, use tools like EXPLAIN to understand query performance, add appropriate indexes, and then ultimately rewrite queries for better performance.